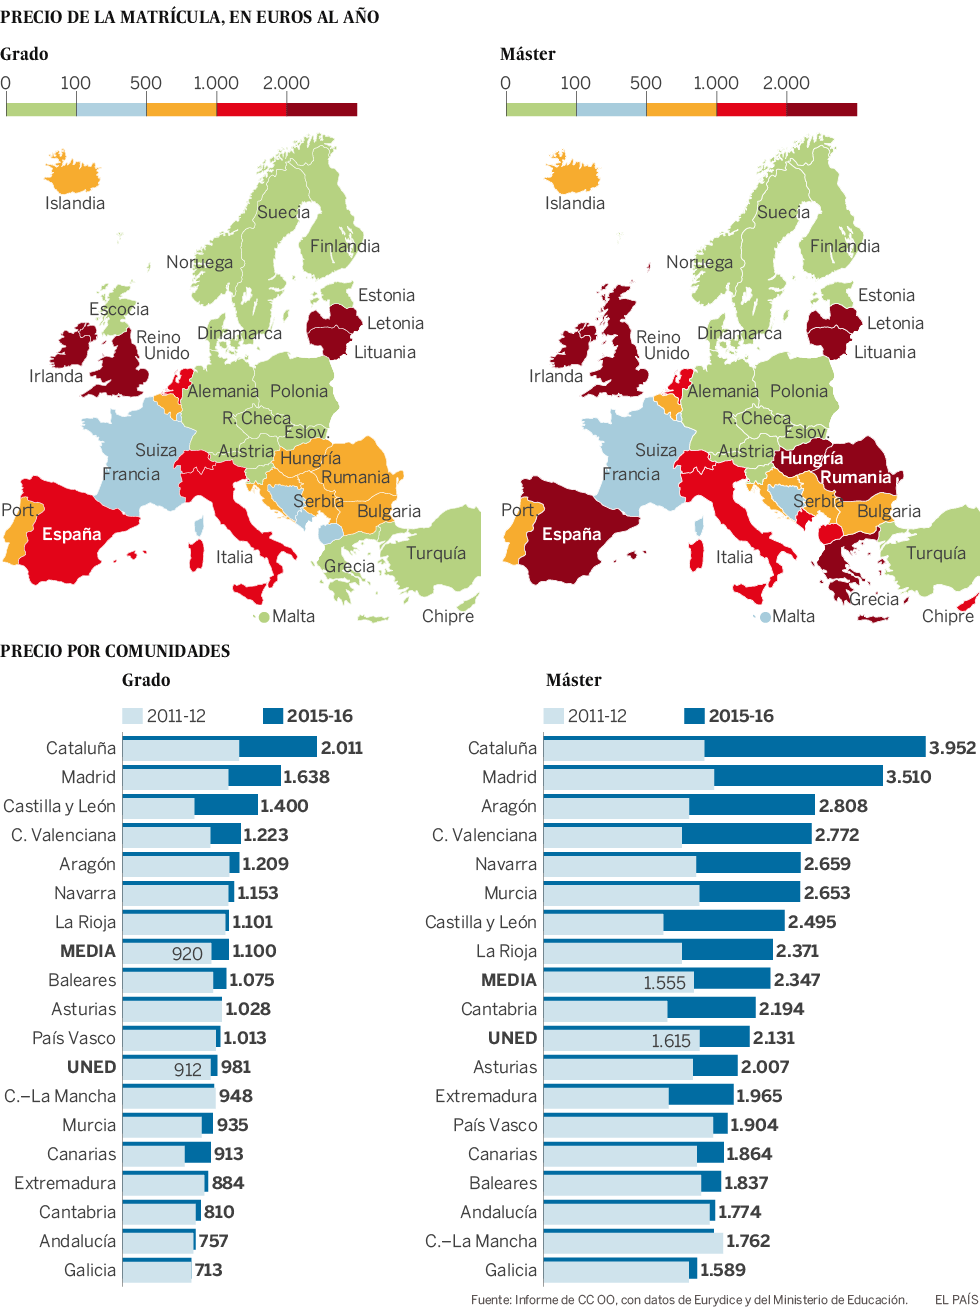
 | ||
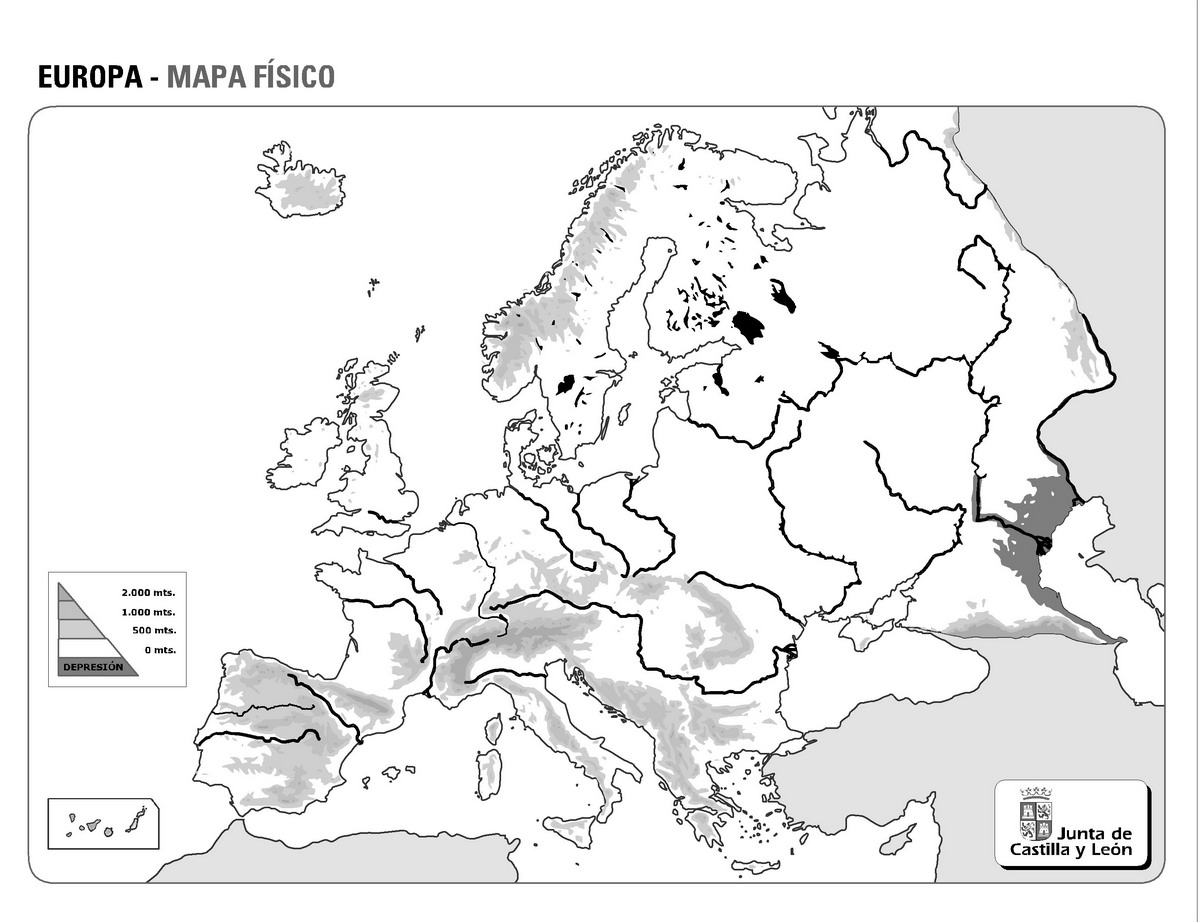
| Porcentaje de obesidad en mujeres por países en 2014, según un código de colores. Fuente: NCD-RisC, citado en el artículo. |
martes, 26 de abril de 2016
Cuestión de peso
viernes, 15 de abril de 2016
lunes, 11 de abril de 2016
Geography Matters
 |
Life expectancy of 40-year-olds with household incomes below $28,000,
|
The Rich Live Longer Everywhere.For the Poor, Geography Matters.
For poor Americans, the place they call home can be a matter of life or death.
The poor in some cities — big ones like New York and Los Angeles, and also quite a few smaller ones like Birmingham, Ala. — live nearly as long as their middle-class neighbors or have seen rising life expectancy in the 21st century. But in some other parts of the country, adults with the lowest incomes die on average as young as people in much poorer nations like Rwanda, and their life spans are getting shorter.
In those differences, documented in sweeping new research, lies an optimistic message: The right mix of steps to improve habits and public health could help people live longer, regardless of how much money they make.
One conclusion from this work, published on Monday in The Journal of the American Medical Association, is that the gap in life spans between rich and poor widened from 2001 to 2014. The top 1 percent in income among American men live 15 years longer than the poorest 1 percent; for women, the gap is 10 years. These rich Americans have gained three years of longevity just in this century. They live longer almost without regard to where they live. Poor Americans had very little gain as a whole, with big differences among different places.
Where the Poor Live the Longest
Where the Poor Live the Shortest
MEN
| New York City | 79.5 |
| San Jose, Calif. | 79.5 |
| Santa Barbara | 79.4 |
| Santa Rosa | 79.0 |
| Los Angeles | 79.0 |
| San Francisco | 78.8 |
| San Diego | 78.8 |
| Miami | 78.3 |
| Newark | 78.2 |
| Boston | 78.1 |
WOMEN
| Miami | 84.2 |
| New York City | 84.0 |
| Santa Barbara | 84.0 |
| San Jose, Calif. | 83.7 |
| San Diego | 83.4 |
| Port St. Lucie, Fla. | 83.3 |
| Newark | 83.2 |
| Los Angeles | 83.2 |
| Portland, Me. | 83.1 |
| Providence, R.I. | 83.1 |
MEN
| Gary, Ind. | 74.2 |
| Indianapolis | 74.6 |
| Detroit | 74.8 |
| Louisville, Ky. | 74.9 |
| Tulsa, Okla. | 74.9 |
| Toledo, Ohio | 74.9 |
| Oklahoma City | 75.0 |
| Dayton, Ohio | 75.1 |
| Knoxville, Tenn. | 75.1 |
| Las Vegas | 75.1 |
WOMEN
| Las Vegas | 80.0 |
| Oklahoma City | 80.2 |
| Tulsa, Okla. | 80.3 |
| Honolulu | 80.3 |
| Detroit | 80.5 |
| Cincinnati | 80.5 |
| Indianapolis | 80.6 |
| Des Moines | 80.6 |
| Gary, Ind. | 80.7 |
| Little Rock, Ark. | 80.7 |
Among the 100 largest metro areas in the U.S.
Suscribirse a:
Entradas (Atom)
Rebajas

Alfons López, en Público, 4 de julio de 2014
Mafalda (Quino)
